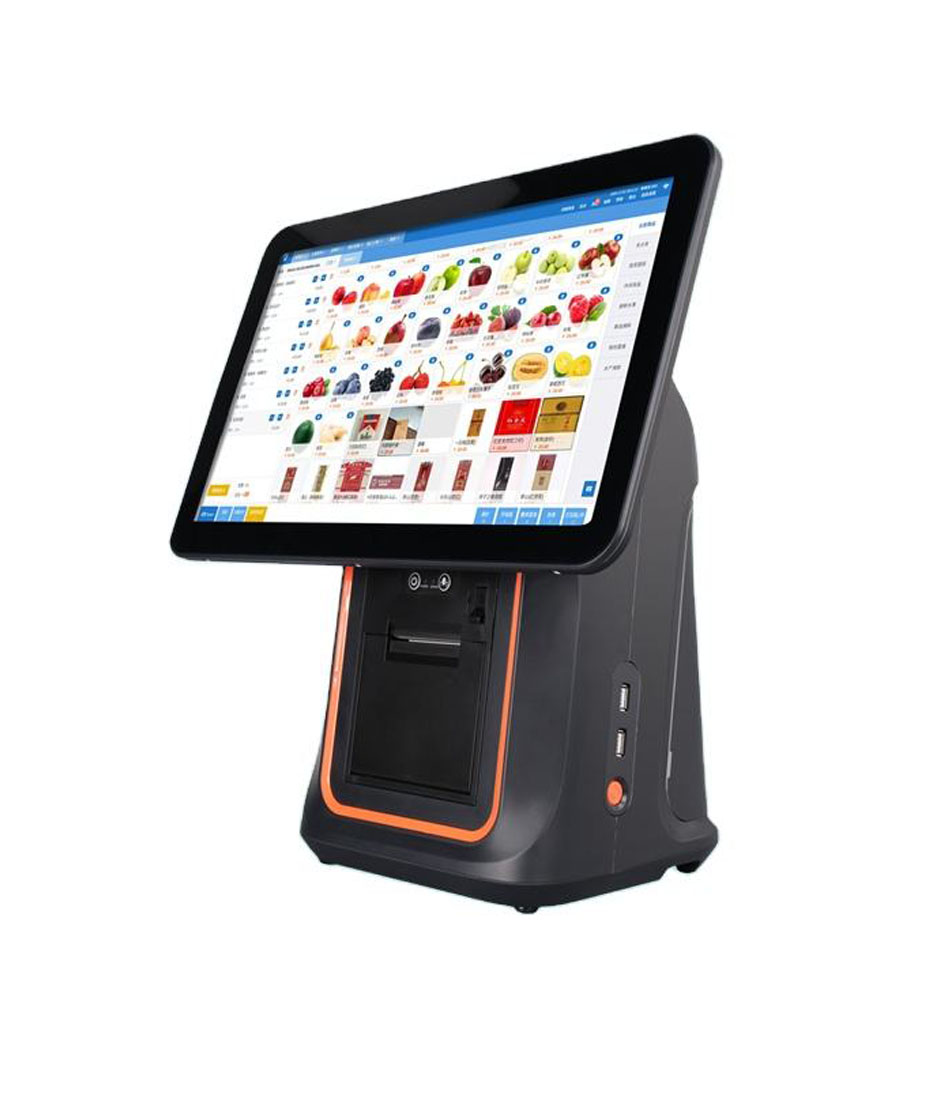
A self-ordering kiosk has two financial effects and they are usually confused. One is labour: fewer staff-minutes per order. The other is basket size: more items per order. Run the arithmetic on both and the second one pays for the kiosk while the first one barely covers maintenance. That is the single most useful thing to know before buying one.
What a kiosk does and does not replace
A kiosk does not remove a member of staff. Somebody still greets, seats, answers questions, handles cash when the machine refuses a note, clears a jam and wipes the screen. What the kiosk replaces is the fixed cost of a second till during a peak that lasts ninety minutes. That is a real saving, and it is much smaller than it feels.
| Cost or benefit | Where it comes from | How it scales |
|---|---|---|
| Peak capacity | An extra ordering point without an extra person | Only during the peak hours |
| Labour minutes per order | Self-service instead of assisted | Per order, all day |
| Basket size | Suggested add-ons at the point of decision | Per order, and it is where the money is |
| Staff time on maintenance | Cleaning, paper, faults, help | Per machine, per day |
| Fees | Card processing on a larger basket | Percentage, so it grows with the benefit |
Throughput: the number that limits everything
The ceiling on a kiosk’s value is how many orders it can take per hour, and that number is not what a vendor quotes. A vendor quotes the theoretical figure, which is the time from first tap to payment complete. A shop experiences a longer figure, because people hesitate, change their minds, and occasionally pay twice.
| Step | Fast user | Typical user | First-time user |
|---|---|---|---|
| Browse and choose | 20 to 30 s | 35 to 50 s | 60 to 90 s |
| Customise | 10 s | 15 to 25 s | 30 to 45 s |
| Review and confirm | 5 s | 10 to 15 s | 20 s |
| Pay | 15 to 20 s | 20 to 30 s | 30 to 60 s, with one retry |
| Total per order | 50 to 65 s | 80 to 120 s | 140 to 215 s |
Divide 3,600 by the total and the ceiling appears: 55 to 72 orders an hour for a fast user, 30 to 45 for a typical one, 17 to 26 for a first-timer. In a shop with a menu of forty items and a lunch peak, assuming 30 orders per hour per machine is realistic and even slightly optimistic. That figure, not the vendor’s, is what the arithmetic below uses.
Why the machine looks idle at 3 pm
A kiosk sized for the lunch peak spends the rest of the day at five percent utilisation. That is not a fault, it is what peak capacity costs. The mistake is buying peak capacity for a shop whose peak is short and shallow: the asset is idle for twenty-two hours a day and still needs cleaning, paper and a network.
The labour arithmetic, done honestly
Take a machine at 1,800 dollars, a shop doing 240 orders a day, and 35 percent of those orders going through the kiosk. That is 84 orders a day, about 25 of them at lunch. Assume the kiosk saves 15 seconds of staff time per order compared with a staffed till, which is generous, since somebody still has to be available.
| Line | Per day | Per year |
|---|---|---|
| Orders through the kiosk | 84 | 30,660 |
| Staff minutes saved | 21 minutes | 128 hours |
| Value of that time at 15 dollars an hour | 5.25 dollars | 1,918 dollars |
| Maintenance: clean, paper, help, faults | 12 minutes, 3.00 dollars | 1,095 dollars |
| Net labour benefit | 2.25 dollars | 821 dollars |
| Payback on labour alone | 800 days | Two years and two months |
Two years and two months, before a single fault, before the first payment module replacement, and assuming the saving is real rather than theoretical. That is not a business case, and it is the honest answer to the question the headline on most kiosk pages is asking.
The basket arithmetic, which is the actual case
The reason kiosks sell is not labour. It is that a customer ordering from a screen adds an item they would not have asked for, because the screen offers it at the moment of decision and a person at a till does not. The effect is measurable, it varies by menu, and it is where the payback comes from.
| Type of shop | Kiosk orders per day | Average basket | Uplift | Extra per day | Payback at $1,800 |
|---|---|---|---|---|---|
| Quick service, 240 orders | 84 | 12 dollars | 8 percent | 80.60 dollars | 22 days |
| Coffee, 300 orders | 75 | 6 dollars | 10 percent | 45.00 dollars | 40 days |
| Food court, 400 orders | 120 | 10 dollars | 6 percent | 72.00 dollars | 25 days |
| Quick service, 60 orders | 21 | 12 dollars | 8 percent | 20.16 dollars | 89 days |
The fourth row is the one to study. A low-volume shop still pays back in under three months on paper, and on paper is where it stays, because a single machine serving 21 orders a day costs the same to maintain as one serving 84 and produces a quarter of the benefit. This is why the decision threshold is not the payback period but the daily order count.
The uplift is also not a property of the hardware. It comes from how the menu is laid out, where the add-ons appear, and whether the default options are the profitable ones. A kiosk that presents the menu as a flat list of forty items produces no uplift at all, which is why the same hardware appears in case studies with eight percent and in real shops with nothing.
Test the uplift before buying the machine
The basket uplift is the whole business case, and it can be measured for almost nothing before spending anything. Take one week and change one thing: ask every customer, out loud, whether they want the item you would put at the top of a kiosk screen. Record the yes rate.
If a person asking the question cannot move the rate above three percent, a screen will not do it either, because the constraint is the menu rather than the channel. If the asked rate is eight percent or more, the kiosk will likely match it and hold it, since the prompt is consistent and does not get tired at the end of a shift. That single week separates a shop that will get an eight percent uplift from a shop that will get nothing and blame the hardware.
The same test answers a second question, which is which item to promote. The item with the highest yes rate at the till is not always the one with the highest margin, and the right choice is the product of the two. A kiosk that promotes the highest-margin item with a two percent acceptance rate earns less than one that promotes a mid-margin item with ten percent.
The costs that are not the machine
Four lines sit outside the purchase order and each one is easy to underestimate.
| Line | Typical figure | Note |
|---|---|---|
| Card processing on the extra basket | 2.4 to 2.9 percent | Grows with the benefit, so it reduces but never eliminates it |
| Installation: power, network, floor fixing | 150 to 600 dollars per unit | Floor-standing units need a fixed point and often a dedicated circuit |
| Software licence | 20 to 60 dollars per month per machine | Often the second-largest line after hardware |
| Consumables | 30 to 80 dollars per month per machine | Printer paper, and cleaning supplies that vanish quietly |
The card fee line deserves attention because it is the one that looks like a cost of the kiosk and is actually a cost of the extra revenue. Paying 2.7 percent on an additional eighty dollars a day is two dollars and sixteen cents, against eighty dollars of revenue. It is not the problem. The problem is when a shop counts the extra revenue and not the fee, and reports an uplift that never reaches the bank.
When the arithmetic does not work
Four conditions, and a shop that meets two of them should not buy a kiosk yet.
- Under about 120 orders a day. The machine cannot serve enough orders to earn its maintenance, and the peak it relieves is too short to matter.
- A menu that is mostly conversation. Customisation that needs a person to explain it produces abandoned orders, and abandoned orders at a kiosk are worse than a queue, because nobody notices the customer walking away.
- A basket under about five dollars. A percentage uplift on a small basket is a small number, and the fixed costs do not shrink with it.
- A shop with no space in the right place. A kiosk behind a door, or facing a wall, or in a draught, will be used at half the rate of one on the path from the entrance to the counter.
The mirror image is also worth stating. A shop with a sharp ninety-minute lunch peak, a short menu of photographable items, a basket above eight dollars and a clear path from the door will usually find that one kiosk pays for itself in the first quarter, and that the limit on its value is floor space rather than demand.
FAQ
How many orders per hour can one kiosk take?
Thirty is a realistic planning figure for a menu of forty items, and fifty is the ceiling with fast, familiar users. Vendors quote the time from first tap to payment complete, which excludes hesitation and is roughly half the real figure.
Does a kiosk reduce staff?
It reduces the number of staff needed at peak, and rarely reduces the headcount. The saving is in the second till during ninety minutes, not in a wage. Shops that buy a kiosk expecting to remove a position usually find the position reappears as somebody helping people use the kiosk.
What is a realistic payback period?
On labour alone, two years or more. On basket uplift, one to three months. The difference between those two numbers is the entire business case, and it depends on menu design rather than on hardware.
Where to go next
Size the kiosk for the peak, then check whether the peak is long enough to pay for it. The labour arithmetic rarely closes; the basket arithmetic usually does.
Choosing kiosk hardware: screen, brightness, payment module, service access Five checks on installation day and the five faults that follow Where AI genuinely helps on a kiosk, and the data each use needs · self-ordering, self-checkout or check-in